Leveraged Loan Market – Preliminary Year in Review
While it was certainly a volatile first half of the year in the leveraged loan markets amidst the backdrop of the Covid-19 pandemic, the second half of the year demonstrated resiliency for certain pockets of the market. A more detailed analysis will be shared in early 2021, once December data is finalized.
BancAlliance members have exclusive access to analysis on C&I loan markets. Here is a sneak peek of our year-end summary, which members will receive once finalized in January. If you would like to receive the final version, please contact info@bancalliance.com
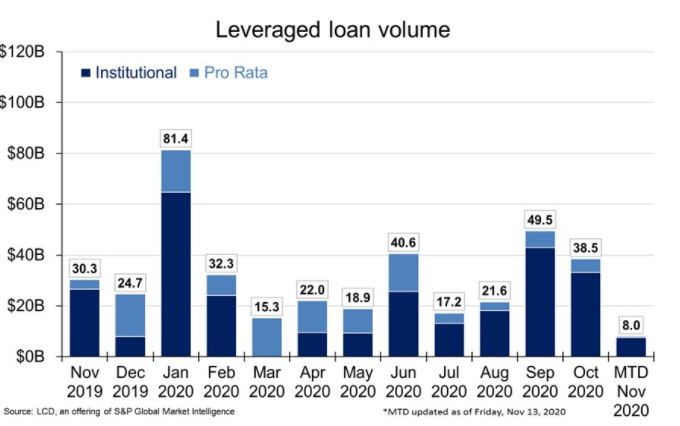
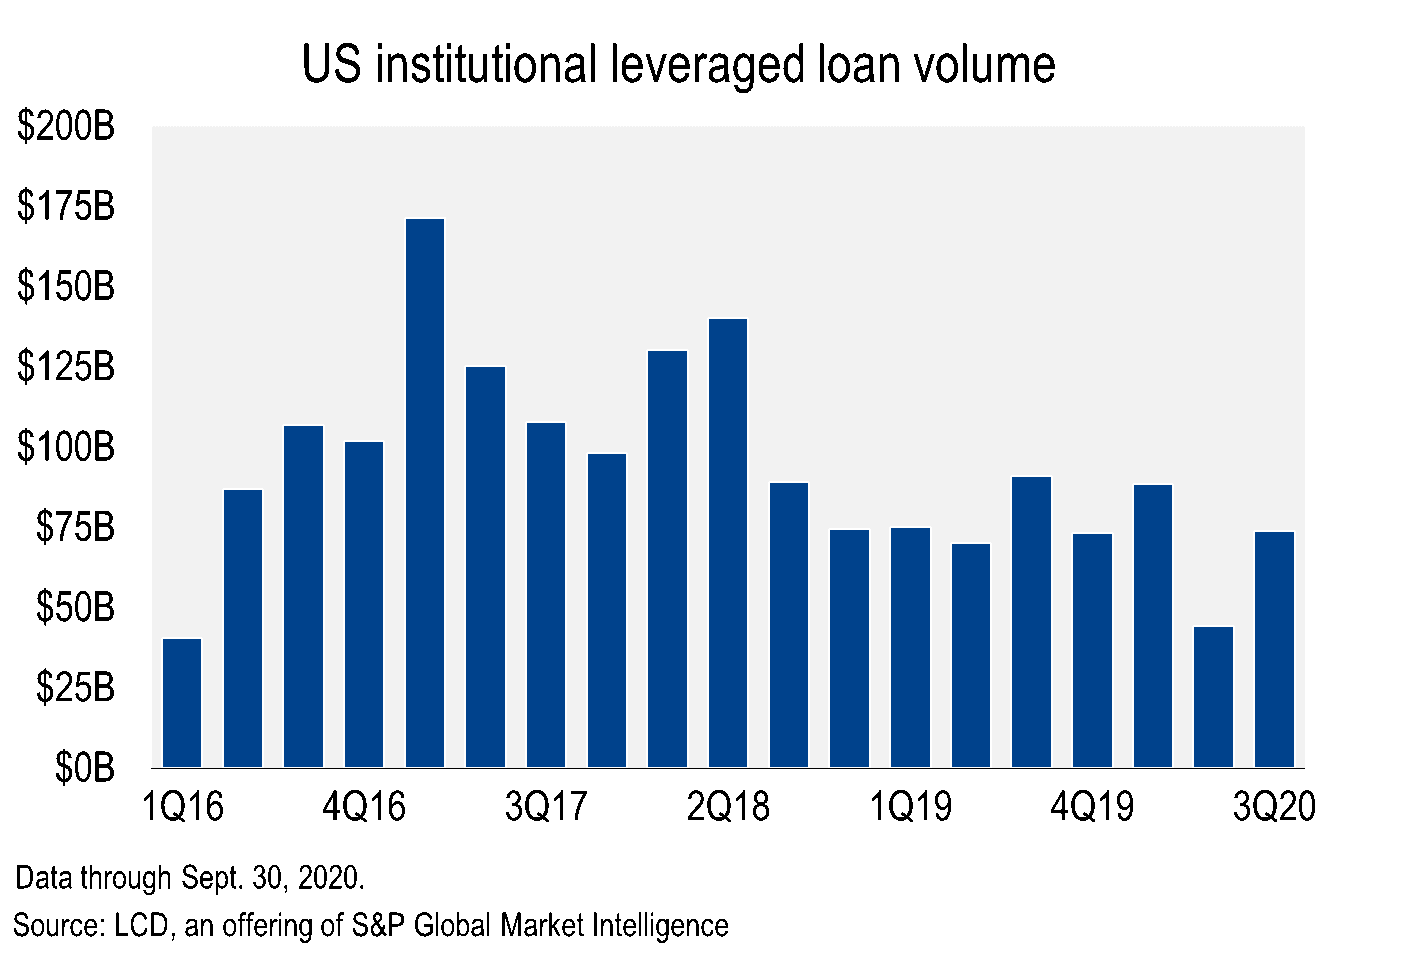
Leverage Loan Volume
Loan volume fell significantly during March – May 2020, the height of the economic shutdown. Volume returned in June before slowing down for the remainder of summer… More recently, September through November has been showing a return to normalcy with the new-issue market showing healthy levels of activity.
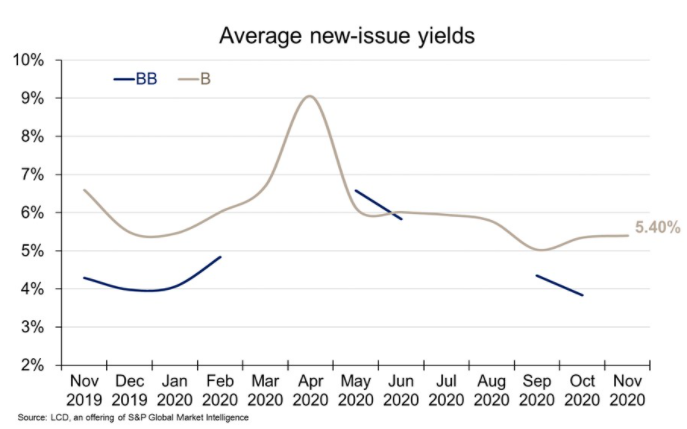
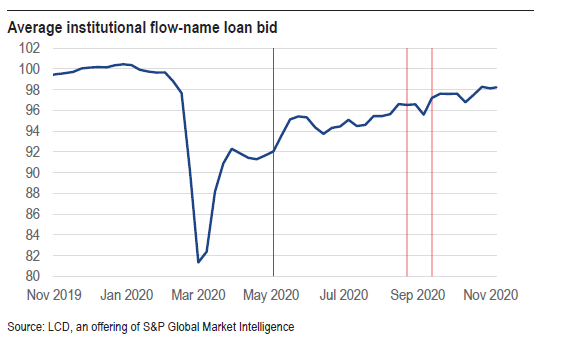
Price and Yield
Average new issue yield initially spiked from March through May 2020 and then retreated, favoring issuers. Similarly, the average price for institutional flow names (i.e. a benchmark of 15 names that trade frequently) plummeted in late Q1 and early Q2, with a rebound to a current level of 98.27 as of 11/30/2020.
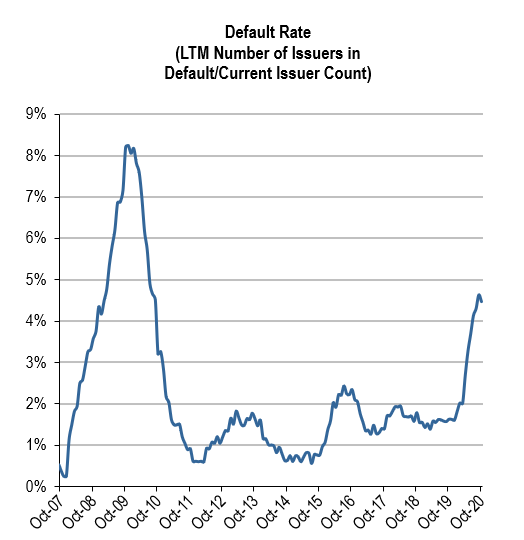
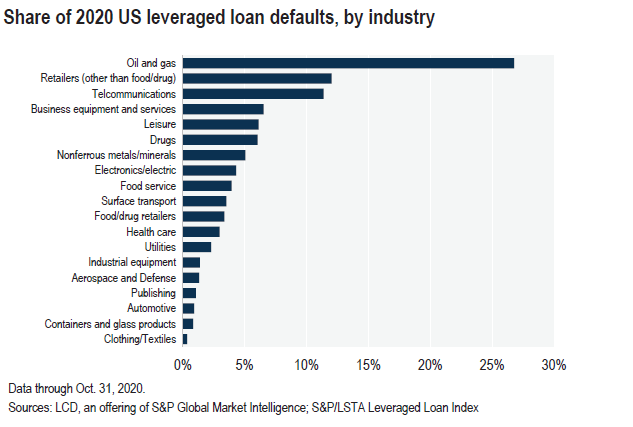
Defaults
The LTM default rate based on number issuers is currently 4.48%, compared to a high of 8.25% during the great recession in 2008-2009. However, the number of issuers is meaningfully higher today than it was then. Not surprisingly, the defaults to date have been concentrated in industries that have been hard hit by the pandemic: oil & gas, retail, business services and leisure industries.
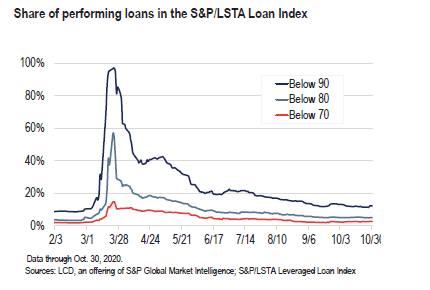
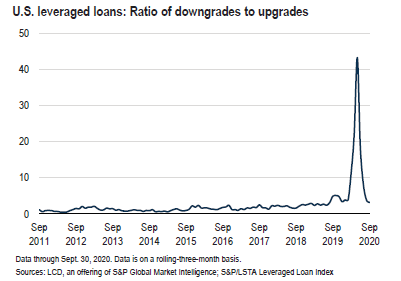
Distress
Overall distress in the market has moderated, with only 4.85% of loans priced below 80 cents on the dollar as of October 30th. For this subset of loans below 80, this compares to the March 23th peak of 57% and a 2019 average of only 3.25%. The pace of downgrades by the ratings agencies had retreated to pre-COVID-19 levels by the end of September, with the rolling three-month ratio of downgrades to upgrades falling to 3.1x from the high of 43x in May and a still stressed 18x in June. In fact, the current reading is below the year-end 2019 level, at 3.4x, although it’s higher than the 2.3x average seen between 2017 and 2019.
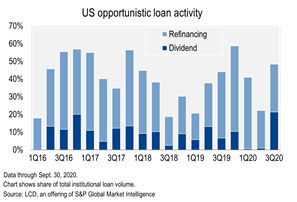
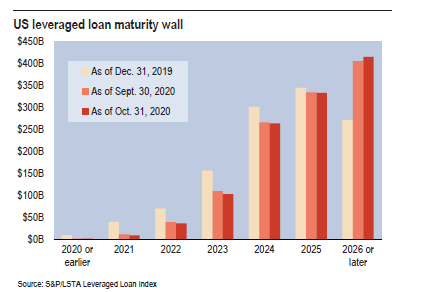
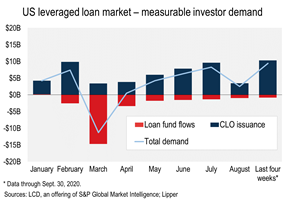
Bright Spots and Other Trends
Due to the wave of opportunistic refinancing that has occurred recently due to low interest rates, the loan maturity wall does not appear to be an issue until 2024, when $264BN becomes due. Much of the return has been driven by increased investor demand, and in particular, by CLOs – rumors of their demise are once again proven to be false.